As you can, see I have created a dot plot from a website:
# Of Francs in Your Pocket
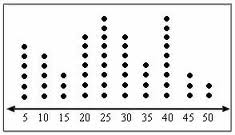
The x axis represents the number of Francs people had, and each dot represents one person. As you can see, 25 and 40 were the most common total, with a large range between 5 and 50. In the next graph you can see the totals broken down between day student and boarding students.

No comments:
Post a Comment